Anoxic conditions, or the lack of dissolved oxygen at depths in the lake, were discussed at June 4 Community Forum and in the Final Watershed
Management Plan (WMP). Per the WMP, “a build-up of legacy phosphorus in bottom sediments can be released back into the water column under low oxygen conditions, typically experienced in late summer – a phenomenon known as internal phosphorus loading. The model showed that internal phosphorus loading to Lake Kanasatka is significant…” The release of the nutrient phosphorus in turn feeds cyanobacteria blooms. Also stated in the WMP, “It is likely the internal load will need to be addressed to fully restore the excellent water quality of Lake Kanasatka.” An in-lake treatment (alum) is the likely path we would pursue to address, or lock in, the phosphorus in the bottom sediments (WMP Section 2.1.4.). Work on these efforts is already under way. Your Water Quality Team started early and implemented new testing beginning in spring of 2022 at the Deep Site (WMP Section 6.4 Monitoring Plan). We conducted full profiles throughout the water column approximately every other week from May into early October. The following graph shows the extent of anoxia (dissolved oxygen under 2 mg/L).
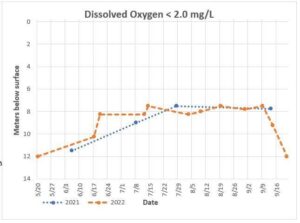
The graph shows anoxic conditions start developing near the bottom and expand higher into the water column during early summer, and level out somewhat during late summer. The drop shown in fall 2022 relates to the breaking up of the thermal layering (temperature and density differential that separates the water column into distinct, non-mixable layers), when the oxygen then can mix freely into the deeper parts of the lake again.
The graph shows, in both years, anoxic conditions are prevalent at 8+meters, sometimes as shallow as 7.5 meters from the surface. This data is indicative of the worse scenario laid out in Figure 9 of the WMP, which shows the map of the extent of anoxia at 8.5+meters and 7.5+meters. The data indicate most of our lake bottom will need treatment. The 4 profiles in 2021 are shown in blue, and the 13 profiles in 2022 are shown in orange. The left-hand axis of ‘meters below surface’ depicts the data as a cross section of the water, with 0 being the surface and 13-14 being the bottom of the lake.
Submitted by Lisa Hutchinson
November 2022 Newsletter